Practical Implementation of Bias and Variance in Machine Learning
Setting the Scene:
Machine Learning is a fast-paced technology that is running the entire world, getting embedded through the domains in nook and corner of the world.
Living in a data-based world, where there are zillions of data that are being generated every day, it has become mandatory for people dealing with complex ML algorithms to get acquainted with large datasets. Dealing with large datasets, it becomes difficult to generate apt learning algorithms which directly impact the accuracy of the model. Sometimes the data might be in an improper format, contains outliers, might be noisy, and so on... Of course, there are all gross-level disturbances that might be dealt with in Data cleaning practices.
What if, the data is skewed? Or does the output data changes with changing the subsets of it? These are on a deeper level, right? These couldn't be identified simply by mere Exploratory analysis. It requires some deeper study and practice.
And so the concept of Bias and Variance comes into the picture. These are the traits that should not be present while fitting the model. Else, that results in a poor model.
What are they? How will they be identified? What is their relationship between them? Let us learn about it all.
What is Bias?
Context:
How does an ML model work? In general, an ML model analyses the data and finds the patterns in it to make predictions. While training, the model learns the patterns of the dataset, and then it tests itself by applying its learning to the test set. Good to note that, test set hathe s already got the correct values (the ones in the data), but the model tries to predict the values not lookingby into the actual values ( like how you appear for an examination).
While making predictions, a difference occurs between prediction values made by the model and actual values/expected values, and this difference is known as bias errors or Errors due to bias. Simply put, it can be said that bias is the inability of the ML algorithm to find the true relationship between the data points.
Reasons? We have discussed this. Could be noisy data, improper formatting or the data could itself be as such. There is nothing to do about it.

Okay, that's a simple way to an understandable approach But we all wanted a consolidated "Exam-type" definition right? :D
To put it in formal language,
Definition:
Bias is a phenomenon that skews the result of an algorithm in favor or against an idea. Bias is considered a systematic error that occurs in the machine learning model itself due to incorrect assumptions in the ML process.
Technically, we can define bias as the difference between the average model prediction and the ground truth.
Sounds confusing? But no! You have understood the same thing previously. There is just the change in the choice of words :D
It is important to note that, each algorithm is built on some assumptions. These assumptions are required to be generated for the simplicity of the model. There are even some cons to it. This is the major reason why bias occurs.
Based on the number of assumptions the model makes, it could be divided as:
1. Low bias: A Low bias model will make fewer assumptions about the form of the target function.
2. High bias: A model with a high bias makes more assumptions, and the model becomes unable to capture the important features of our dataset. A high bias mhigh-bias cannot perform well on new data.
Why doesn't a high-bias model doesn't perform well on new data? Simple.
It is because, the modelgets acclimatized only with a particuladata based on the individual assumptions it has made. So, the same principles might not work with a new data.# What is Variance?
Context:
For the different changing values in the data, how is the variation in the prediction? In simple words, variance tells how much a random variable differs from its expected value.
Simple example. Model is trThe model with a label "cat". When a cat is given, it predicts. When dog is alsoa given, it predicts a cat. This is variability.

Definition:
Variance is the variability in the model prediction—how much the ML function can adjust depending on the given data set. Variance coThe variance highly complex models with a large number of features.
1. Low Variance: Low variance means there is a small variation in the prediction of the target function with changes in the training data set.
2. High Variance: High variance shows a large variation in the prediction of the target function with changes in the training dataset.
A model that shows high variance learns a lot and perform welperformsthe training dataset, and does not generalize well with the unseen dataset. As a result, such a model gives good results with the training dataset but shows high error rates on the test dataset.
Bias-Variance Relationship:
Bias and Variance is what we arell as the prediction errors for ML algorithms. While it is important to note that, we must reduce the possible errors, having said, note that these errors are general that happen.
For the best possible model, we must reduce both these errors. Here is another problem. We cannot have a model with low variance and low bias. Because Bias and Variance are negatively correlated
That means, for a model with low bias must have high variance, high bias ma ust have low variance and vice-v,ersa. This is practically impossible. So, need for optimal solthe ution. which is called,
Bias Variance Trade-off
Bias and variance are inversely connected. It is impossible to have an ML model with a low bias and variance.
When a data engineer modifies the ML algorithm to better fit a given data set, it will lead to low bias—but it will increase variance. This way, the model will fit with the data set while increasing the chances of inaccurate predictions.
The same applies when creating a low varianclow-variance a higher bias. While it will reduce the risk of inaccurate predictions, the model will not properly match the data set.
It’s a delicate balance between these biases and variance. Importantly, however, having a higher variance does not indicate a bad ML algorithm. Machine learning algorithms should be able to handle some variance.
We can tackle the trade-off in multiple ways…
Increasing the complexity of the model to count for bias and variance, thus decreasing the overall bias while increasing the variance to an acceptable level. This aligns the model with the training dataset without incurring significant variance errors.
Increasing the training data set can also help to balance this trade-off, to some extent. This is the preferred method when dealing with overfitting models. Furthermore, this allows users to increase the complexity without variance errors that pollute the model as with a large data set.
A large data set offers more data points for the algorithm to generalize data easily. However, the major issue with increasing the trading data set is that underfitting or low biassensitive to the training data set. Therefore, increasing data is the preferred solution when it comes to dealing with high variance and high bias high-bias.
Enough of theory. You might want to learn the practical implementation in the datasets indicating bias and variance
Let's dive into it! Dataset: World Population Dataset.
Dataset is available here:Kaggle World Population Dataset
Contains different attributes like:
Necessary imports:
import pandas as PD
import numpy as np
import matplotlib.pyplot as pyplot
from sklearn import preprocessing
from statistics import mean
Import the data
df=pd.read_csv("world_population.csv")
df.head()

Let's drop the CCA3 column
df.drop(columns='CCA3',inplace=True)
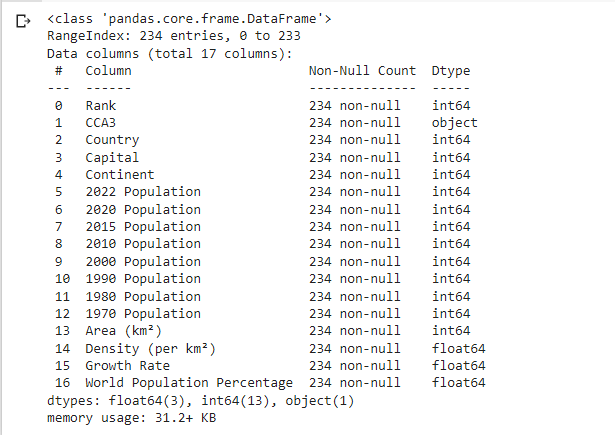
df.info()
Let us try to convert the categorical values into numerical values using encoding techniques
label_encoding=preprocessing.LabelEncoder()
df['Country']=label_encoding.fit_transform(df['Country'])
df['Capital']=label_encoding.fit_transform(df['Capital'])
df['Continent']=label_encoding.fit_transform(df['Continent'])
Let us try to divide the training and testing sets
y=df['World Population Percentage']
df=df.drop('World Population Percentage',axis=1,inplace=False)
y

Train the dataset:
from sklearn.model_selection import train_test_split
from sklearn.linear_model import LinearRegression
X_train, X_test, y_train, y_test= train_test_split(df,y,test_size=0.2,random_state=42)
model=LinearRegression()
model.fit(X_train,y_train)
Prediction
pred=model.predict(X_test)

Variance:
variance=np.var(pred)
print(variance)
Output: 0.5135314512545637
Bias:
sum_of_squared_erros=np.mean((np.mean(pred))**2)
bias=sum_of_squared_erros-variance
print(bias)
Output: -0.35874320233543733
We have seen that this model has low bias and high variance, which is an indication of Linear Regression.
Identification of bias and variance is done.
What about its correction and rectification? It is a whole lot of process in the journey of a Data Science Research based project.
This is it for this blog.
Hope you found something interesting.
Best, Praseeda.
